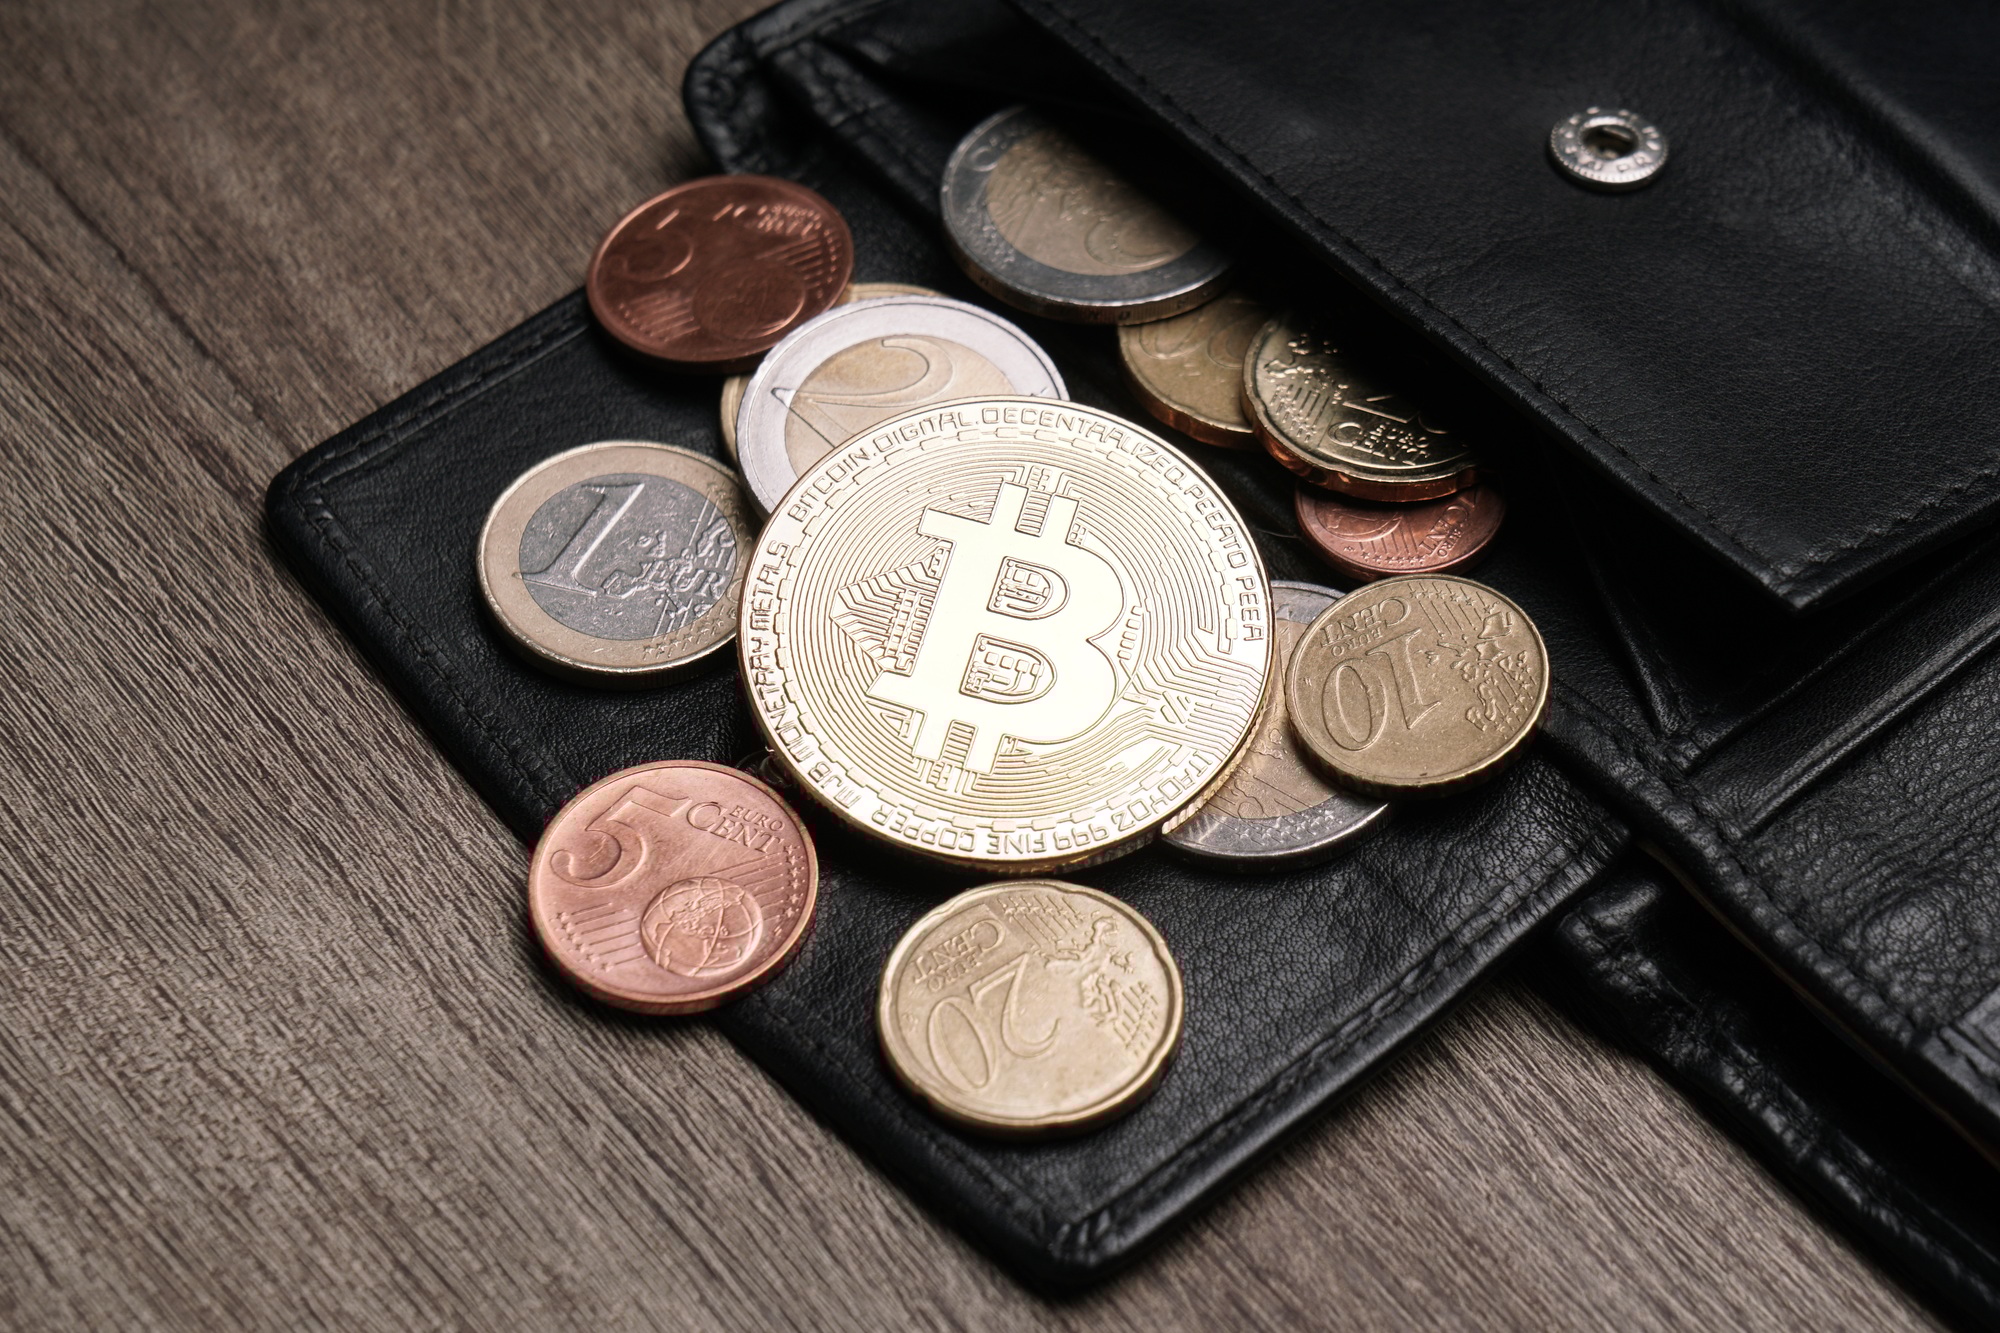









Bitcoin and Ethereum in August: What History Tells Us


August often arrives with a familiar question in crypto: is this a month to expect a rally, or should investors prepare for a pullback?
Looking at past price data, the answer is less exciting but more useful: August has more often been a weak month than a reliably bullish one for both Bitcoin and Ethereum. Still, the history is far from uniform.
Bitcoin has produced major August rallies, especially during strong bull-market periods. Ethereum has also had standout months, including periods where it significantly outperformed Bitcoin. But across the last decade, negative Augusts have been more common than positive ones.
That does not tell us what will happen this year. It does, however, help put the month’s price moves into perspective.
How we measured August performance
For this comparison, an August return is calculated by comparing the price at the end of July with the price at the end of August.
The table below covers the most recent ten completed Augusts, from 2016 to 2025. Percentages are rounded.
| Year | Bitcoin August return | Ethereum August return |
|---|---|---|
| 2016 | -7.9% | -1.9% |
| 2017 | +63.6% | +87.1% |
| 2018 | -9.5% | -34.8% |
| 2019 | -4.5% | -20.6% |
| 2020 | +3.2% | +25.3% |
| 2021 | +13.3% | +36.0% |
| 2022 | -14.1% | -7.5% |
| 2023 | -11.3% | -11.3% |
| 2024 | -8.7% | -22.9% |
| 2025 | -6.5% | +18.9% |
Bitcoin’s August record: more red than green
Bitcoin finished August higher in only three of the ten years shown above: 2017, 2020 and 2021.
Its strongest August came in 2017, when Bitcoin rose about 63.6%. That was a very different market environment from a normal year. Retail interest was accelerating, new capital was flowing into crypto, and the wider market was in a powerful bull run.
The more typical recent picture has been softer. Bitcoin fell in August in four consecutive years from 2022 to 2025.
Across this ten-year sample, Bitcoin’s median August return was approximately -6.7%. Median is useful here because a single extraordinary month, such as August 2017, can make the average look better than the experience in a typical year.
In plain language, Bitcoin has not historically treated August as a dependable “up only” month.
Ethereum has also been volatile, but with bigger swings
Ethereum’s August history tells a similar story, with much larger moves in both directions.
ETH rose in four of the ten Augusts in this sample. Its strongest August was also 2017, when it gained about 87.1%. It also recorded solid gains in 2020, 2021 and 2025.
But the losing months have been severe. Ethereum dropped about 34.8% in August 2018, 20.6% in 2019 and 22.9% in 2024.
The median August return for Ethereum over the same period was about -4.7%.
This does not mean Ethereum has a better seasonal profile than Bitcoin. It means that ETH can move more aggressively in either direction. When risk appetite is strong, Ethereum has often outperformed. When the market turns cautious, it can also decline faster.
Why can August be difficult for crypto?
There is no single explanation that applies every year. Crypto does not follow a fixed calendar.
However, August can coincide with several conditions that make markets more sensitive:
- Trading activity may be thinner during holiday periods in major financial centres.
- Lower liquidity can make price moves sharper when large buyers or sellers enter the market.
- Investors may take profit after a strong first half of the year.
- Macro events, interest-rate expectations, exchange-traded fund flows and regulatory news can quickly outweigh any seasonal pattern.
- In crypto, leverage can amplify even a relatively small price move into a large liquidation event.
The key point is that seasonality is not a cause. It is only a description of what happened in a limited set of previous years.
2017 shows why averages can mislead
If someone only looked at the average return across all Augusts, they might conclude that the month has been positive for Bitcoin and Ethereum.
That would be misleading.
The 2017 gains were so large that they pull the average higher. Yet most of the years in the table were negative. This is why investors should look beyond one summary number and consider the full range of outcomes.
For Bitcoin, August has included a gain above 60% and a loss above 14%.
For Ethereum, it has included a gain above 87% and a loss close to 35%.
Historical data is useful precisely because it shows how wide the possible outcomes can be.
Bitcoin and Ethereum do not always move the same way
Bitcoin and Ethereum are often grouped together, but August 2025 is a useful reminder that their performance can diverge.
Bitcoin fell about 6.5% during the month, while Ethereum gained about 18.9%. The difference reflected market-specific demand and positioning, not just a broad “crypto market” direction.
Bitcoin is increasingly influenced by institutional flows, macro conditions and its role as the largest and most liquid crypto asset.
Ethereum, meanwhile, can react strongly to changes in decentralised finance activity, stablecoin use, staking, network upgrades, tokenisation narratives and demand for its wider ecosystem.
A trader or investor should therefore avoid assuming that a bearish August for Bitcoin automatically means Ethereum will fall by the same amount, or vice versa.
What should investors take from this?
The history of August offers a warning against overconfidence, not a trading signal.
A month that has been weak in many previous years can still produce a strong rally. A month with a positive average can still end in a sharp decline. Crypto markets are affected by liquidity, policy, global markets, adoption, network developments and investor positioning in real time.
For long-term holders using dollar-cost averaging, seasonal data may be more helpful as context than as a reason to stop or start buying. A consistent plan should not depend entirely on whether the calendar has reached August.
For active traders, it is a reminder to pay attention to volatility, position sizing and risk management. Past Augusts show that both Bitcoin and Ethereum can move quickly in either direction.
This article is for educational purposes only and is not investment advice.
Sources
- Bitcoin historical monthly closing-price data
- Ethereum historical monthly returns and price data
- CoinGecko guide to obtaining historical Bitcoin data